Lost Among All The COVID-19 Statistics? Here Are A Few To Watch

Yasmine Protho, 18, graduated in May at Chattahoochee County High School in Cusseta — while wearing a protective mask, with a photo of herself, amid the coronavirus pandemic. There are so many different statistics that tell the story of the pandemic in Georgia, and it can be difficult to know which ones to watch.
Brynn Anderson / Associated Press
Sharon Zydney, a product manager who lives in Atlanta, spends a lot more of her free time these days looking at numbers.
Every afternoon, she’ll take 15 minutes or so to check out the latest statistics on COVID-19 from the Georgia Department of Public Health. It’s one way she’s found to handle the uncertainty of living through the pandemic.
“It’s kind of a way to manage something that’s unmanageable. Understanding the data as it is helps me make sense of what’s going on here,” she said.
Zydney has found a small community of other data-minded people on Facebook whom she talks with about the numbers. They’re all working to figure out exactly what the statistics mean for them and their lives.
But even with that help, Zydney says she doesn’t always know what to make of the state’s figures.
“There’s a lot of it. They break it down in a lot of different ways, but it’s not usable,” she said. “They are not consumer-focused. I want the information in a usable way.”
There are so many different statistics telling the story of the coronavirus pandemic in Georgia. It can be hard to know the best ones to watch. But there is some agreement among public health experts about which numbers are the most meaningful and why.
What’s The Average? What’s The Trend?
“I think one of the helpful statistics is to look at the change from week to week or month to month in a seven-day average of cases,” said Dr. Melanie Thompson, the principal investigator of the AIDS Research Consortium of Atlanta.
Thompson says looking at the average number of cases smooths out some of the variability that comes with collecting data, like a decline in reporting on weekends. Watching that number change over time can show the direction the pandemic is heading.
It’s one of the many statistics the Georgia Department of Public Health tracks on its COVID-19 daily status report webpage.
And it’s been rising steadily in the last few weeks as the state has continued to lift restrictions put in place earlier this year to slow the spread of the coronavirus. On May 9, the seven-day case average hit a low point of 516.1 statewide. On June 11, the most recent date with confirmed data, it sits at 870.7.
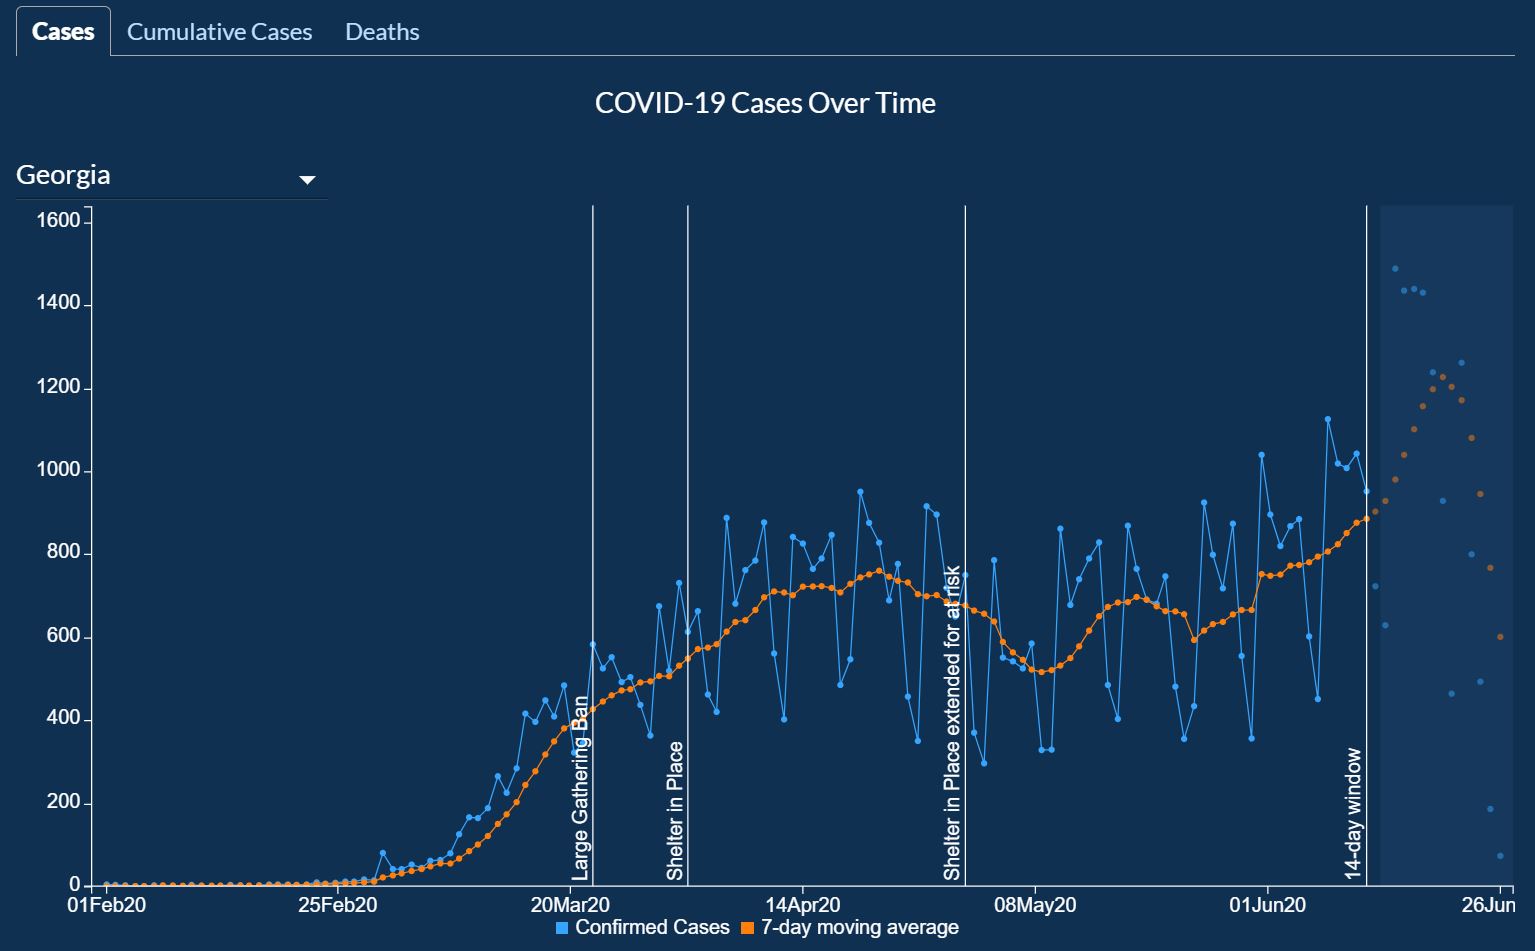
But all epidemics are local, Thompson says, which is why it’s also important to consider average case counts in different parts of the state.
“When we look at different regions in Georgia, what we really see are separate epidemics and clusters that are appearing in different parts of the state,” she said.
Dougherty County in southwest Georgia was hit hard by COVID-19 earlier this year, but it’s seen a steady decline in cases since late March. Gwinnett County, on the other hand, has seen cases rise steadily since that same time.
How Sick Are People Getting? Are They Dying?
Not only can COVID-19 look very different from location to location, it can look very different from person to person.
That’s why monitoring how many people get hospitalized and die because of the disease is so important, says Dr. Colleen Kraft, an infectious diseases physician at Emory University.
“I think that sends a huge message and a huge block of information about who is getting ill right now,” she said.
Data from the Georgia Department of Public Health shows coronavirus-related deaths have been trending down across the state since a peak in late April.
The latest daily COVID-19 situation report from the Georgia Emergency Management Agency also shows current hospitalizations are also down from a previous peak, though they’ve been climbing in recent days.
The overall lower number of hospitalizations and deaths, Kraft says, reflects the rising number of coronavirus infections in younger people, who tend to be less likely to get very sick and need intensive care.
Watching trends in current hospitalizations also helps Kraft, who’s assistant chief medical officer for Emory University Hospital, plan for the future of the pandemic. It can help health care facilities know when to start preparing for a potential influx of patients.
“We really do not want to have another situation such as we had in April where the cases peaked and hospitals were very busy just taking care of COVID patients,” she said. “That prevented us from taking care of other patients well.”
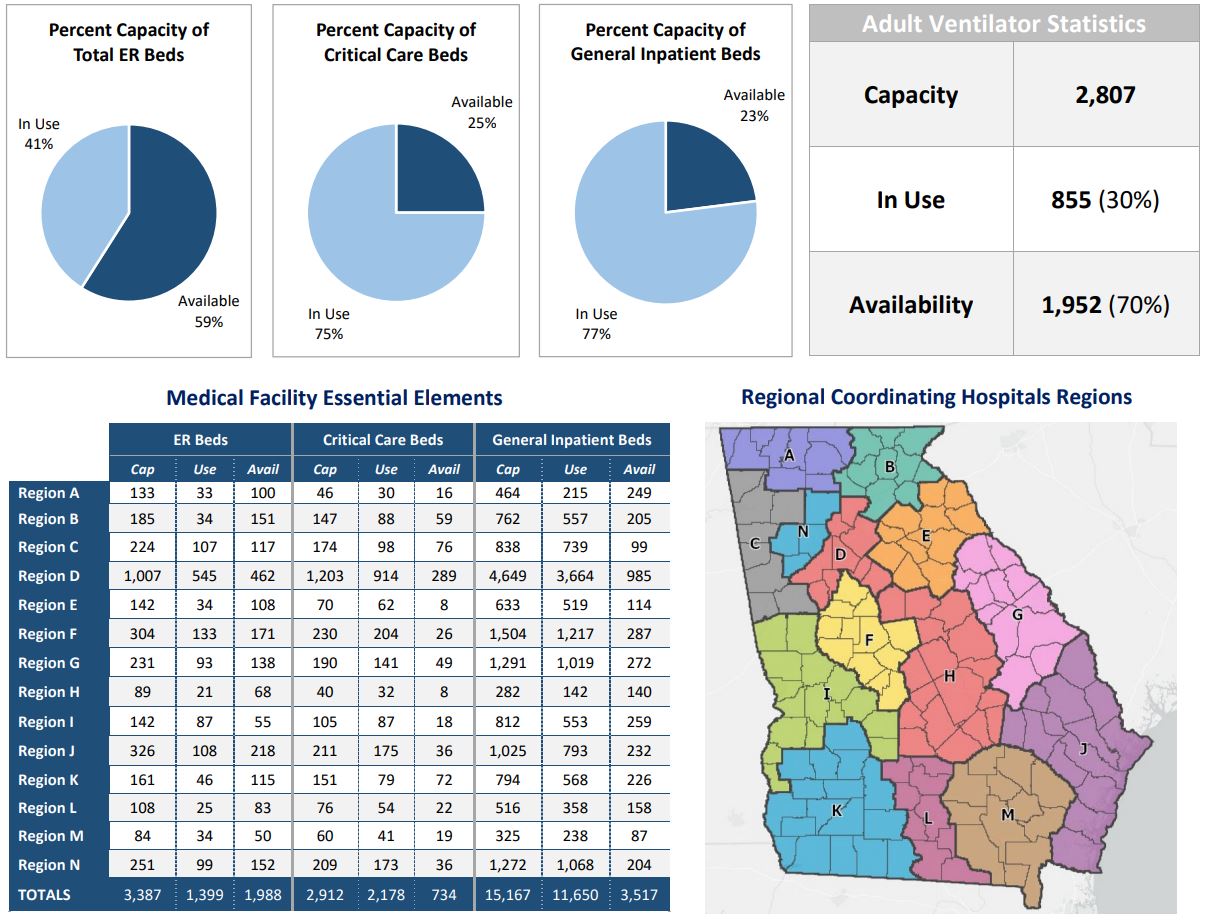
But not all parts of Georgia have the same health care resources to handle another coronavirus surge. State numbers released Thursday show a stark divide: metro Atlanta has hundreds of beds available to care for severely ill patients, while some regions have only a handful.
It’s also important to note that both current hospitalizations and deaths show the effects of infections that happened in the past.
Once someone catches the coronavirus, the Centers for Disease Control and Prevention says it can take as long as a week before they need admission to a hospital. A death could occur days to weeks after that. So, the statistics are not great indicators of the current spread of the virus.
Numbers Have Limits
Even if tracking new cases, hospitalizations and deaths paints a pretty good picture of the coronavirus situation in Georgia, it’s still not a totally clear picture. All statistics have their limitations.
“We know pretty convincingly that for both hospitalizations and deaths, what we’re getting is an undercount,” said Dr. Harry Heiman, who teaches at the Georgia State University School of Public Health.
Hospitals don’t generally count a death as COVID-related unless a person has received a positive test for the coronavirus, Heiman said. He also pointed to New York City, where many people presumed to have the disease died at home without ever being formally tested.
When it comes to current hospitalizations, state data doesn’t include people who might be sitting in hospitals waiting for test results to get returned, individuals referred to as “persons under investigation.”
But these are just state-level issues. The nation’s top public health agency acknowledged this week that it had only captured a small portion of the total coronavirus infections in the U.S. so far. The Centers for Disease Control and Prevention says confirmed COVID-19 cases may be 10 times as high as recorded.
Heiman attributes this hazy data picture to a lack of investment in public health infrastructure at both the state and federal level. And warns against putting too much faith in any statistic tracing the outlines of a situation as complicated as a global pandemic.
“As in all things in public health, data is necessary but not sufficient,” he said. “If you just look at numbers, you’re getting a two-dimensional view of what is always a three-dimensional problem.”


Top Stories