Don’t see the graphic above? Click here.
Crippling drought this year has caused more than $1 billion in damage. As it has played out, anyone affected by the drought or trying to manage it has turned to a once obscure map that has become key to understanding what’s happening: the U.S. Drought Monitor.
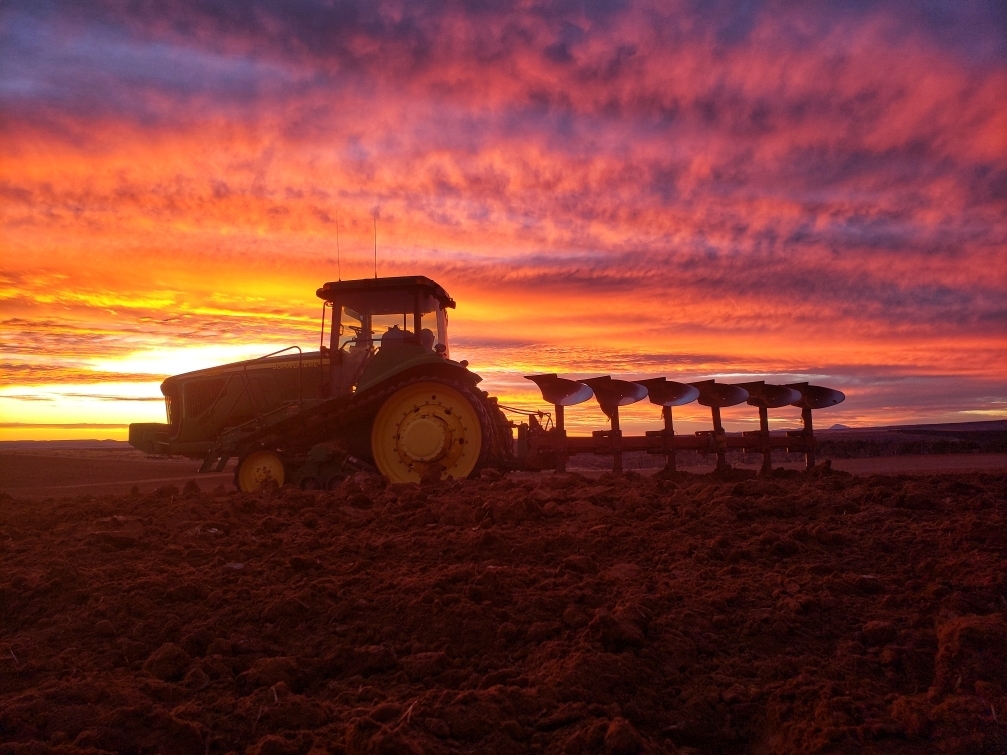
That includes water planners who decide resource allotments. Farmers who need water for their livelihood. Federal bureaucrats who use the map to calculate aid for the Livestock Forage Disaster Program.
Read this story now for free
To continue reading, sign up for our newsletter and get unlimited access to WABE.org
You can select your preferences for news and local content. We will never share your email address. Learn how your newsletter sign-up will support WABE and Public Media