UrbanHeatATL is mapping Atlanta’s temperatures to help those in danger of the heat

This map of a portion of Atlanta shows some of the data collected by volunteer community scientists with UrbaHeatATL. The program has collected over 100 hours of temperature information so far.

Courtesy of UrbanHeatATL

When Chloe Kiernicki leaves her house near Georgia Tech, she takes the temperature wherever she walks.

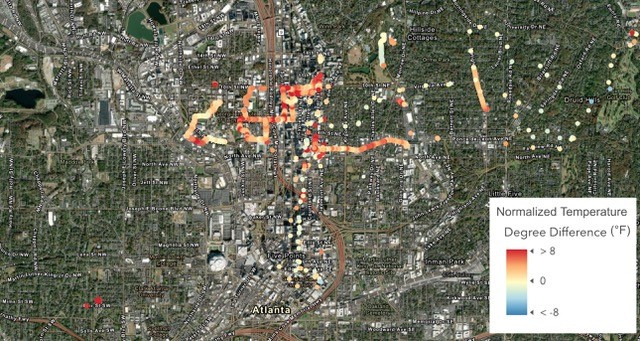
She has what’s basically a very fancy thermometer that she clips onto her bag that records the temperature as she goes, noting when and where it’s hotter or cooler as she moves around her neighborhood.

What she finds as she walks around would probably be familiar to many Atlantans in the summer: smaller streets with trees shading the sidewalk feel cooler than bigger streets with lots of lanes, surrounded by parking lots.

Approaching a busy 14th Street intersection, Kiernicki notes the lack of trees.

“There’s so many roads converging and all these gas stations,” she says. “And so just a lot of concrete right now.”

Kiernicki graduated from Tech this past year. Over the summer, she’s one of dozens of people who volunteered to collect data for UrbanHeatATL, a project lead by professors at Georgia Tech and Spelman College to map how hot it is in parts of Atlanta, street by street.

The goal is to get a more detailed understanding of which neighborhoods in Atlanta are the hottest, and to highlight solutions for the most vulnerable communities.

Chloe Kiernicki is pictured holding a sensor, which collects temperatures as she walks. The information gets uploaded and combined with data that dozens of other volunteers are collecting, too. (Molly Samuel/WABE)

Finding Inequities In Heat’s Effects

It’s not news that Atlanta is hot. Hotter, even, than surrounding rural areas. The phenomenon called the urban heat island effect has been known for decades. Cities are hotter because they have more dark, hard surfaces like concrete and buildings, and fewer trees and other plants that help cool the air.

But even within Atlanta’s heat island, some places are hotter than others. Through this project, Kiernicki is helping to capture the texture of Atlanta’s heat.

Na’Taki Osborne Jelks, an environmental and health science professor at Spelman says the goal is to figure out which communities are in the most danger from heat, and how to help protect them as temperatures continue to rise.

“We know that there are certain populations that are disproportionately affected,” she says.

A study done in 2019 found that redlined neighborhoods — places where people were subject to discriminatory and racist housing policies – are, in many cities, also the hottest.

Jelks says that may not end up being exactly the case here in Atlanta. Southwest Atlanta, for instance, is still largely Black, but also has a lot of tree cover. But neighborhoods closer to Downtown and around the Atlanta University Center, she says, she has hunches about. A separate research project led by University of Georgia scientists is also looking at potential parallels between redlining and urban heat in Atlanta.

Rising Risks

Heat is dangerous. According to the National Weather Service, over the past 30 years, heat has been the leading weather-related cause of death in the U.S., ahead of tornadoes, hurricanes, floods, and cold temperatures.

People with chronic health conditions are more susceptible to the effects of extreme heat. And not everyone in Atlanta has AC or can afford to run it all the time even if they do have it. Atlanta has a relatively high energy burden, the proportion of people’s income that they spend on energy costs.

Dr. Cheryl Holder, a professor at Florida International University and a primary care provider in Miami, says there’s a connection between heat, health and housing.

She says she had a patient who was struggling with her electricity bill because she was using so much of her money on extra inhalers. The heat was worsening her COPD but running her AC didn’t help as much as it could have to alleviate the heat, because her house was so badly insulated.

“There’s so many factors. She didn’t quite connect the dots,” Holder says. “She just knew she couldn’t pay her bills.”

Climate change will keep making it worse.

“When we start talking about climbing up the thermometer to higher and higher and higher records, longer and longer and longer heat waves, we’re going to be experiencing that in the urban core as an exaggerated effect,” says Kim Cobb, a climate scientist at Georgia Tech who’s working with Jelks on the UrbanHeatATL project.

Marshall Shepherd, Director of the Atmospheric Sciences program at UGA and an expert on urban heat islands, says people in cities face a “triple whammy” when it comes to heat stress, with regular heat waves layered on top of climate change, layered on top of the urban heat island.

These maps, using census-tract level data, show how summer nights around downtown are warmer than less densely developed parts of the city. This is part of ongoing work funded by the UGA Vice Provost for Diversity and Inclusion and Strategic University Initiatives. (Courtesy of Jerry Shannon/UGA)

How To Help People Stay Safe

Shepherd’s not involved in the Atlanta heat mapping project, but he says it can be helpful in a couple ways. It’s getting community members involved and informed about heat. And, he says, while the urban heat island effect is already well-understood, this kind of street-level project will bring more nuance to understanding how people experience heat.

“Anytime we can get data, particularly air temperature data, in the crevices and high-density regions and other parts of the actual city, we can paint a more detailed picture of what Atlanta’s urban heat island actually looks like, and in turn, where there may be vulnerable communities,” he says.

The aim of this project, in the end, is to help people in those vulnerable communities.

“That’s the whole point,” says Sadica Murphy, a Spelman student who’s helping to collect temperature information and other related research for the project.

“Right now, we’re just gathering the data to see where the issues are,” she says. “Then we can see, okay, what are the methods that we can employ to assist with being a part of the solution.”

Some of the solutions are physical.

In a study from 2009, Shepherd found that the best ways to reduce the urban heat island effect in Atlanta were to increase vegetation in the city, and to raise the city’s albedo – basically, to replace dark, heat-absorbing surfaces with light, heat-reflecting surfaces. Shepherd says adding vegetation is probably the more feasible of those options.

Though, in recent years, there’s been increasing concern among environmental advocates about the state of the city’s tree canopy and the ability of Atlanta’s tree protection ordinance to protect trees.

“Atlanta has long been known as this city in the forest,” Jelks says. “We are hoping that our tree protection ordinance is strengthened.”

Cobb encourages looking beyond trees, too.

“It has to be a comprehensive plan,” she says. “When we think about not just planting trees and creating phone lines to keep the most vulnerable safe during the heat extremes, but also thinking about really systematically addressing energy burdens and housing standards across our most vulnerable communities.

“If we do not, we will not be doing all we can to keep people safe in this rapidly warming environment,” she says.

Meanwhile, another Atlanta heat mapping project is getting started later this summer – using cars to drive all over the city, in a single-day temperature gathering event. That effort, which is part of a national project, is led by the National Oceanic and Atmospheric Administration and Spelman College. It’s looking for volunteers now.

All combined, these projects will give Atlantans a much better understanding of where it’s hottest — and who’s most vulnerable at a time when it’s already hot and will keep getting hotter.