Dashboard tracks emissions across Georgia

plant scherer georgia emissions carbon dioxide
In this June 3, 2017, file photo, the coal-fired Plant Scherer, one of the nation's top carbon dioxide emitters, stands in the distance in Juliette, Ga. (AP Photo/Branden Camp, File)

This coverage is made possible through a partnership with WABE and Grist, a nonprofit, independent media organization dedicated to telling stories of climate solutions and a just future.

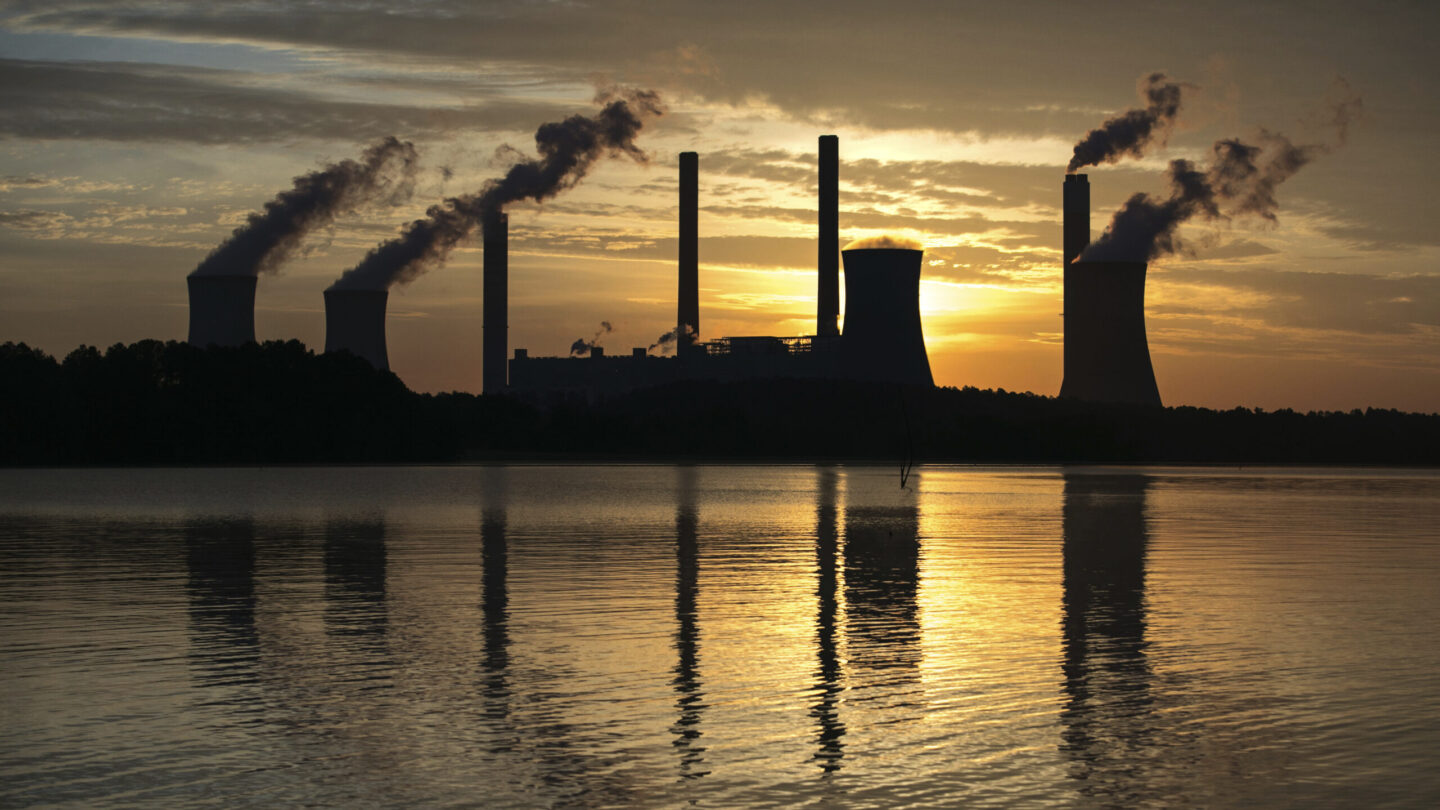
Georgians can now see how much of the pollution that causes climate change is coming from their county. A new tool that shows emissions information by county comes as international scientists have released a report saying action on climate change is more urgent than ever.

The online tracker tallies up greenhouse gas emissions — from transportation, industry, agriculture, homes and businesses — as well as how much carbon trees absorb.

“By looking at the map, you can see the distribution of high emission levels and low emission levels across the state,” said Georgia Tech professor William Drummond, the project’s lead researcher.

For instance, Chatham County — home to the Port of Savannah — has higher transportation and industrial emissions. In counties like Charlton and Ware — home to the vast, undeveloped Okefenokee Swamp — absorption by trees outweighs emissions. 

a map of Georgia alongside emissions statistics and graphs
A new online dashboard tracks greenhouse gas emissions in Georgia county-by-county. (Drawdown Georgia)

The dashboard comes from Drawdown Georgia, a project coordinated by the Ray C. Anderson Foundation that has developed a road map to reach net zero greenhouse gas emissions in Georgia. 

Experts agree that decreasing emissions and ultimately reaching net zero is essential to keep climate change in check. The latest report by the Intergovernmental Panel on Climate Change, released Sunday, finds that impacts of climate change are already widespread and will get worse and harder to adapt to as the planet continues to warm. 

Local advocates said having easy access to local emissions data can help them sell green initiatives to local leaders. 

“So now, we’re not talking in an abstract sense to our local elected officials or business folks about these statewide initiatives,” said Maurice Carter with Sustainable Newton. “We’re saying, ‘hey, look where we are.’”

Carter said the tool can also give them concrete data on the impact of past efforts and help them plan for future development. His region is expecting an influx of new residents thanks to the Rivian electric vehicle plant planned for neighboring Morgan and Walton counties.

“We definitely don’t want them all jumping in an internal combustion car and driving around,” Carter said. 

The tracker can show the impact of transportation emissions, and he hopes it could help demonstrate the need for mass transit to serve the influx of people.

Along with county-by-county data, the greenhouse gas tracker shows emissions from specific facilities, like power plants, landfills and paper mills. 

One fertilizer plant appears as a large blue bubble over Augusta, accounting for 1.73 million metric tons of emissions, nearly two percent of the state total.

“If we can work with this company to reduce their emissions, we can make a really significant impact,” said David Eady of Georgia Tech. 

Eady helps lead the Drawdown Georgia Business Compact, which works with companies to reduce their own greenhouse gas emissions. He said being able to see the emissions from individual facilities will help them know what companies to reach out to as well as specific solutions that might work.

While many climate efforts in Georgia happen company by company or community by community, a new survey suggests that most Georgians believe the state should set a goal to reduce carbon emissions.

The poll, done for researchers at Georgia Tech and the University of Georgia, found that 60 percent of Georgians think the state should set such a target.

It also looked at energy poverty, when a household spends more than 6% of its income on energy. The survey found that lower-income Georgians are also energy poor. Households with an income below $20,000 spend between 14 to 21% of monthly earnings on energy — compared with 2% for households that make over $150,000 a year.